Research note 03 · Quant method explained
When a reversal is just the spread: testing the price behind the signal.
A short-term reversal can look predictable while remaining impossible to capture. Before improving the forecast, investigate what the recorded price actually represents.
01
A clever forecast with nowhere to trade
Suppose a researcher finds that small downward ticks are often followed by upward ticks. A reversal rule looks accurate, and making its threshold more selective improves the historical hit rate. The tempting next step is a more elaborate model. A better first question is simpler: which price is reversing, and could an order have traded there?
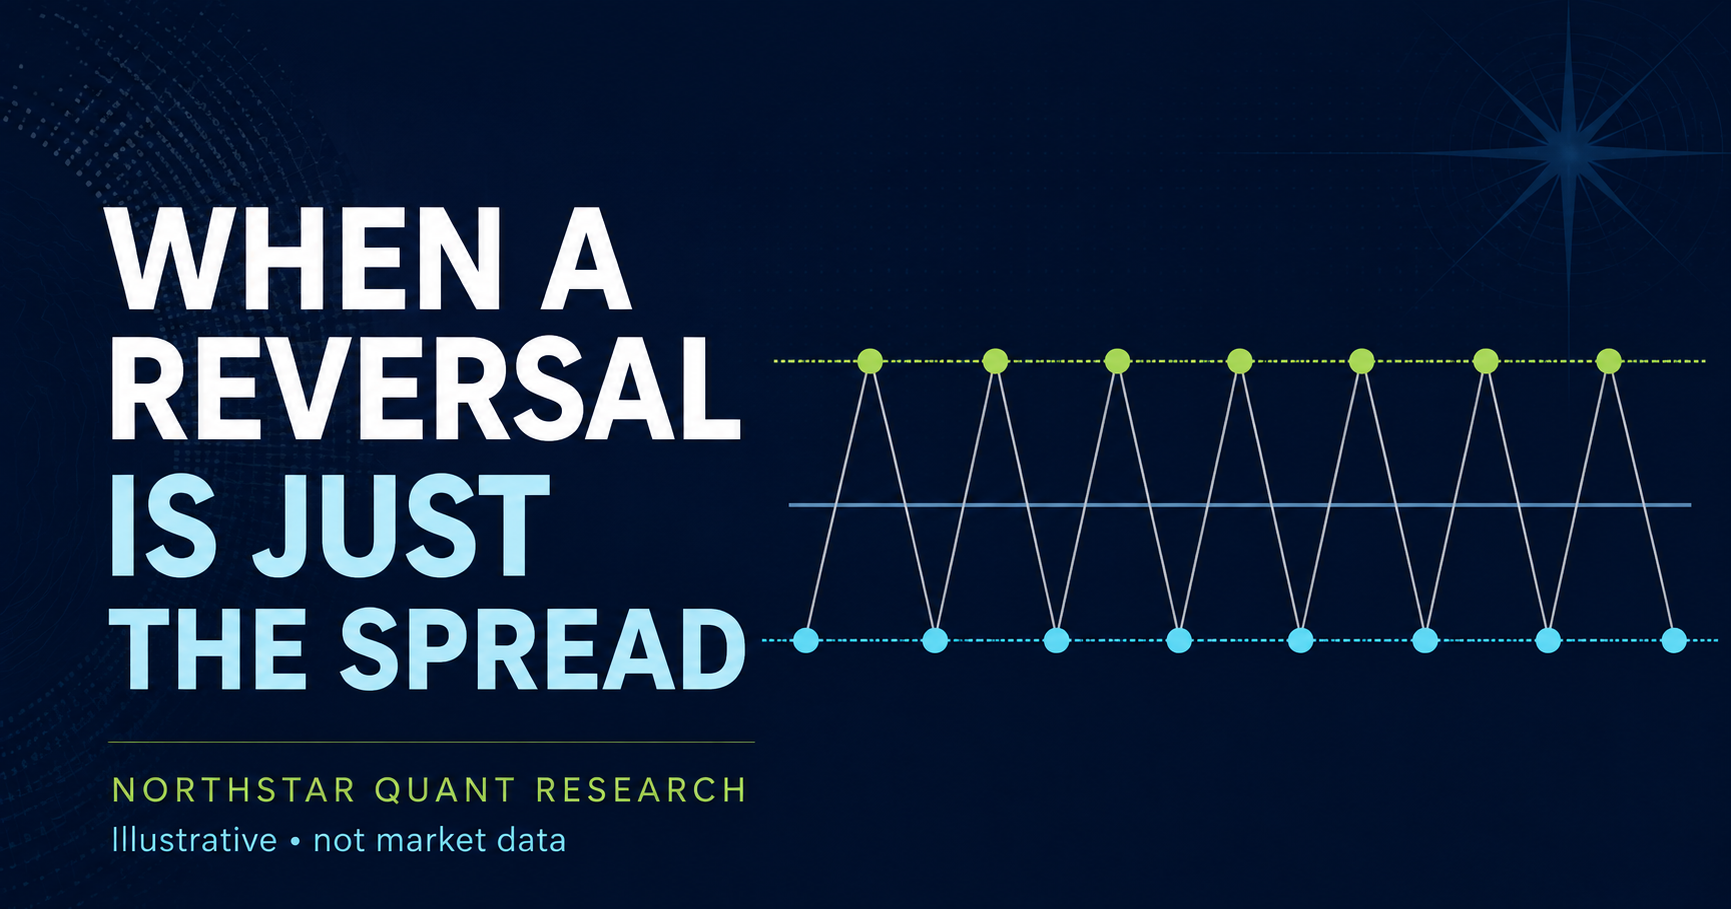
Consider this illustrative example, not market data: the best bid is 99 and the best ask is 101. A seller trades at 99, then a buyer at 101. The recorded price rises by two units, although neither quote changes. A new buyer responding to the first trade still faces an ask of 101, not an available purchase at 99. An immediate sale would face the bid. The apparent move is not a free round trip.
02
The transaction side can create the pattern
The bid is the best displayed buying price; the ask is the best displayed selling price. Their difference is the quoted spread, and their average is the midpoint. Bid–ask bounce occurs when recorded transactions switch sides of that spread. It can produce apparent reversals even without a corresponding change in underlying value.
Richard Roll’s 1984 paper derived a relationship between effective spread and negative serial covariance—the tendency of consecutive price changes to move oppositely—under specific market-efficiency and stability assumptions. That contribution is a measurement model, not a promise that negative dependence can be profitably traded. Real order flow, changing spreads and news can violate the simplifying assumptions. A covariance estimate alone is therefore not a diagnosis.
03
Design a diagnostic before designing a filter
A practical investigation could begin with a frozen sample of trades and contemporaneous best quotes from the same venue. Preserve exchange timestamps and local receipt times, and document how equal timestamps are ordered. Join each trade only to a quote that was available before the decision. Looking up the nearest quote without a causal constraint can silently attach future information.
Next, measure the candidate reversal on two aligned series: transaction prices and quote midpoints. Compare consecutive-change covariance, reversal frequency and subsequent midpoint movement. Segment the comparison by spread size and quote age. If the effect concentrates in transaction prices while midpoint movement is weak, bounce becomes a plausible explanation worth investigating—not a proven cause.
Save the sampling rule, missing-data decisions and instrument list with the results. Exclude crossed, invalid or stale quotes using rules fixed in advance, and report how much evidence those exclusions remove. A clean-looking subset can otherwise hide precisely the difficult conditions in which a strategy would operate.
04
More observations need a better noise model
Sampling faster does not automatically provide a cleaner measurement. The paper How Often to Sample a Continuous-Time Process in the Presence of Market Microstructure Noise shows, for its estimation setting, why unmodelled noise can make a finite sampling frequency preferable, while explicitly modelling that noise can make fuller use of the observations. This is an estimation result, not evidence that a faster trading strategy is better.
For the proposed diagnostic, inspect several predeclared sampling intervals instead of selecting whichever makes the hypothesis look strongest. Midpoints also need scrutiny: a stale quote can look artificially calm, and a displayed price does not guarantee sufficient depth for the intended order. When synchronized quotes are unavailable, mark the microstructure explanation unresolved rather than reconstructing certainty from candle closes.
05
Replay the order, not the attractive print
A testable improvement would flag candidates whose apparent edge disappears after quote-based measurement and realistic execution. Freeze the original reversal rule as the baseline. Create one challenger that adds the proposed diagnostic, keeping the universe, decision times and holding rules comparable. Specify the diagnostic threshold before the final evaluation period; do not keep adjusting it after disappointing results.
Evaluate on later, untouched dates. Simulated aggressive buys should use available asks and sells available bids after a stated latency, with depth-aware slippage and applicable fees. Include funding or borrowing costs where relevant to the instrument and holding period. Do not switch to passive fills merely to rescue the result: those require a separate model of queue position, missed fills and adverse selection, meaning fills that arrive just before prices move against the order.
Compare net expectancy per eligible opportunity and per executed trade, turnover, fill rate, drawdowns and performance across spread conditions. Use comparable position limits and risk budgets, and disclose changes in actual exposure. Preserve skipped candidates so missed opportunities remain measurable. Estimate uncertainty with a method that respects clustered observations, such as resampling whole trading days rather than treating every tick as independent.
06
What would change the conclusion?
The bounce explanation weakens if the reversal remains in fresh midpoint data and retains an economically meaningful net edge under credible execution assumptions. The proposed filter fails its usefulness test if later evidence shows no improvement at comparable risk, or if it removes genuine opportunities more often than costly false signals. Fewer trades and a smoother equity curve do not, by themselves, establish better prediction.
This experiment has no reported results here. It is a reproducible proposal for separating price measurement from forecasting, not an assertion that Northstar currently applies this filter or executes orders. A sophisticated signal engine should be able to explain its evidence; sometimes the most valuable explanation is why a statistically visible movement was never an available trade.
Measure the opportunity you could actually access
Before celebrating a reversal model, ask whether it predicts changing quotes or merely alternating transaction sides. A pattern can be real in the data and still fail the test of executable returns.
Primary and relevant research
General educational information, not investment advice or a recommendation. Futures and leveraged products carry substantial risk. No model or historical result guarantees future performance.
This note may use an automated drafting and publication workflow. See the editorial and corrections policy for sourcing, automation and correction standards.