Research note 04 · Live market anatomy
When leverage becomes the seller: reading a forced-deleveraging move.
A violent price move can contain both new information and mechanical position closure. The research problem is not to label every sell-off a liquidation cascade, but to test whether leverage, liquidity and price changed together in a way that alters continuation risk.
01
The candle does not identify its cause
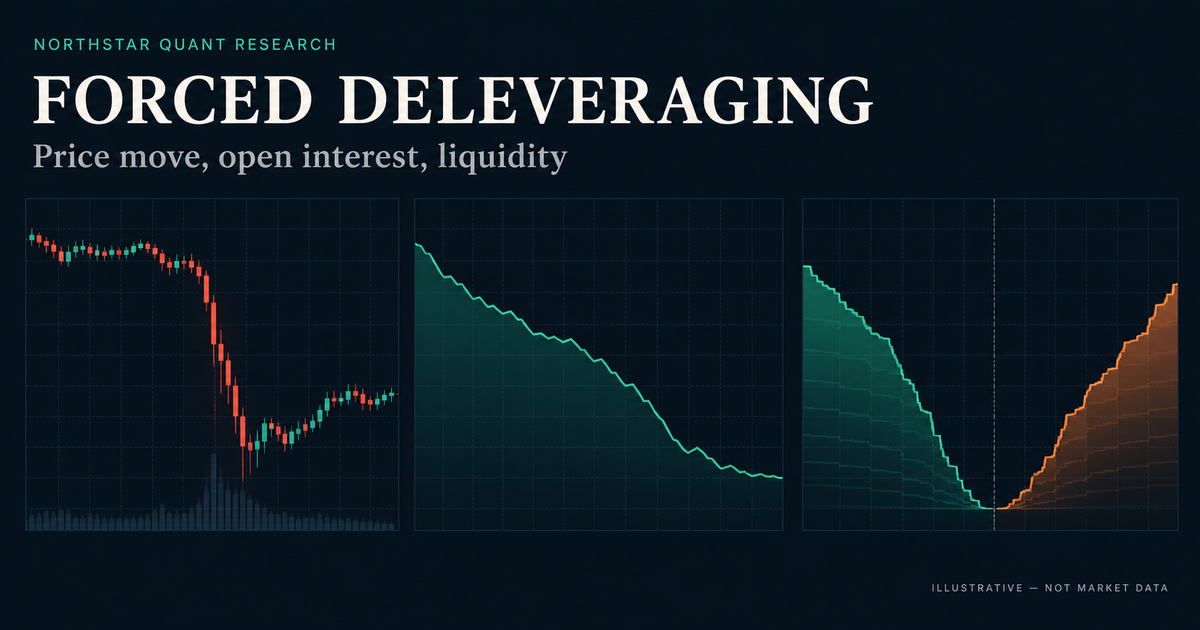
Consider an illustrative scenario, not market data. A perpetual contract falls rapidly while open interest contracts and displayed depth near the best quotes becomes sparse. The same price path could reflect adverse public information, a large discretionary seller, margin-triggered closures, or several mechanisms acting together. Calling it a “liquidation cascade” from the candle alone replaces measurement with a story.
The precise research question is narrower: can a predeclared combination of leverage contraction and liquidity stress improve the forecast of whether an extreme move continues, stabilizes or partially retraces? The goal is not to prove who traded. It is to determine whether observable market anatomy changes the conditional risk of the next interval.
02
Why forced closure can reinforce a move
Leveraged positions must maintain sufficient margin. OKX documents that its futures liquidation process is linked to the maintenance-margin ratio and uses a mark price rather than the latest transaction to reduce unnecessary liquidations from abnormal prints. When risk limits are breached, orders may be cancelled, positions reduced and, if necessary, liquidated. These are venue rules, not a universal description of every exchange, so implementation details must be mapped venue by venue.
Markus Brunnermeier and Lasse Pedersen formalized a broader feedback mechanism between funding liquidity and market liquidity. When tighter financing constraints reduce dealers’ capacity to provide liquidity, price moves can worsen constraints and produce reinforcing liquidity spirals. Their model is not a crypto liquidation detector. It supplies a disciplined reason to test feedback between balance-sheet pressure and trading conditions instead of treating volume or volatility as self-explanatory.
03
Open interest needs a direction-aware reading
Open interest counts outstanding contracts; it is not a direct count of bullish or bearish conviction. Price down with open interest down is consistent with positions being closed, but it does not reveal whether long liquidation, short profit-taking or contract migration dominated. Price down with open interest up can reflect new short exposure, new hedges or basis trades. Neither quadrant is a standalone signal.
A useful event record should therefore preserve contract-level open interest, mark and index prices, funding or basis, trades, best quotes and several depth bands. OKX’s public API exposes open interest and order-book endpoints, which makes this measurement feasible on that venue without private account data. Receipt timestamps matter: attaching an end-of-minute open-interest value to a decision made earlier in the minute would create look-ahead leakage.
04
Define the anatomy before looking at the outcome
One testable diagnostic could require three contemporaneous components: an extreme return relative to recent robust volatility, a material fall in open interest, and deteriorating executable liquidity measured by wider spreads or less depth at fixed basis-point distances. Thresholds should be estimated only on a training window and then frozen. Report the components separately so a model cannot hide a weak mechanism behind a composite score.
The event clock should begin when the full diagnostic becomes observable, not at the candle’s favorable extreme. Normalize depth in quote currency and account for instrument size, contract changes and exchange maintenance. Flag stale books, crossed quotes, API gaps and suspected venue outages. A sharp move during missing data is not clean evidence; it is an unresolved observation.
The principal failure mode is post-hoc narration. If researchers adjust the open-interest decline, volatility threshold and recovery horizon after seeing each outcome, almost any dramatic chart can be made to fit. Keep every attempted specification in a trial ledger and retain rejected events so selectivity remains auditable.
05
Test whether the state changes forecast quality
Freeze a momentum-only baseline and compare it with one challenger that adds the cascade diagnostic. Use chronological splits and untouched later dates. Define outcomes in advance—for example, continuation versus partial reversal over the next four hours using midpoint returns—and include fees, spread crossings, latency and funding where the proposed action would incur them. The horizon is illustrative and should be justified for the intended system.
Evaluate probability calibration, log loss, precision for rare events, net expectancy under the same risk budget, drawdown and opportunity count. Break results out by instrument and volatility regime, but shrink small groups toward a broader prior rather than promoting a pair after a handful of wins. Resample whole event clusters or trading days so nearby observations are not treated as independent evidence.
A result is useful only if the challenger improves later-period calibration or risk-adjusted outcomes without relying on one venue, one instrument or one crisis. Fewer trades alone do not prove better decisions. Compare exposure and missed opportunities explicitly.
06
What would falsify the explanation?
The diagnostic fails if its apparent advantage disappears on untouched data, after realistic execution costs, or when exchange outages and contract migrations are excluded. The forced-deleveraging interpretation also weakens if open interest does not contract, liquidity does not deteriorate, or similar outcomes occur just as often when the components are absent. Even a successful forecast would establish association, not trader-level causation.
This experiment has no reported results here. Its value is operational: it turns a vivid market story into timestamped measurements, a frozen comparison and a falsifiable claim. A research engine should be allowed to conclude that a move remains ambiguous. Uncertainty is more credible than a precise narrative built from one dramatic candle.
Treat liquidation as a hypothesis, not a label
A large move plus falling open interest can motivate investigation, but only a causal, venue-aware comparison of leverage, liquidity and later price behavior can show whether the state improves decision quality.
Primary and relevant research
General educational information, not investment advice or a recommendation. Futures and leveraged products carry substantial risk. No model or historical result guarantees future performance.
This note may use an automated drafting and publication workflow. See the editorial and corrections policy for sourcing, automation and correction standards.